ChainConsumer
2016-08-01
My python library to digest MCMC chains and create plots.
I was working with some chains one day and wanted to plot different cosmologies against each other, and realised that they had different parameters. Unfortunately, this meant that the library I was using couldn’t handle the task, so I wrote my own!
If you want to know more and see plenty of examples see the online documentation here.
The API is fairly straightforward I hope, with a simple example shown below.
import numpy as np
from numpy.random import normal, multivariate_normal as mv
from chainconsumer import ChainConsumer


if __name__ == "__main__":
    np.random.seed(0)
    cov = normal(size=(3, 3))
    cov2 = normal(size=(4, 4))
    data = mv(normal(size=3), 0.5 * (cov + cov.T), size=100000)
    data2 = mv(normal(size=4), 0.5 * (cov2 + cov2.T), size=100000)

    c = ChainConsumer()
    c.add_chain(data, parameters=["$x$", "$y$", "$\\alpha$"])
    c.add_chain(data2, parameters=["$x$", "$y$", "$\\alpha$", "$\\gamma$"])
    fig = c.plot()
And the above code gives the following contour:
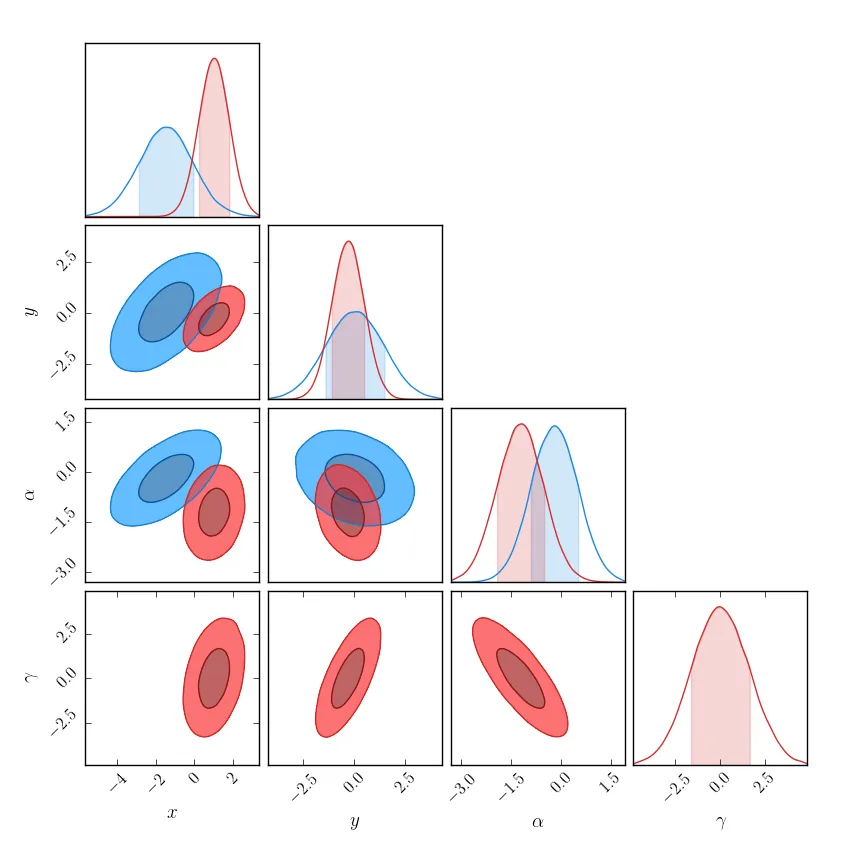
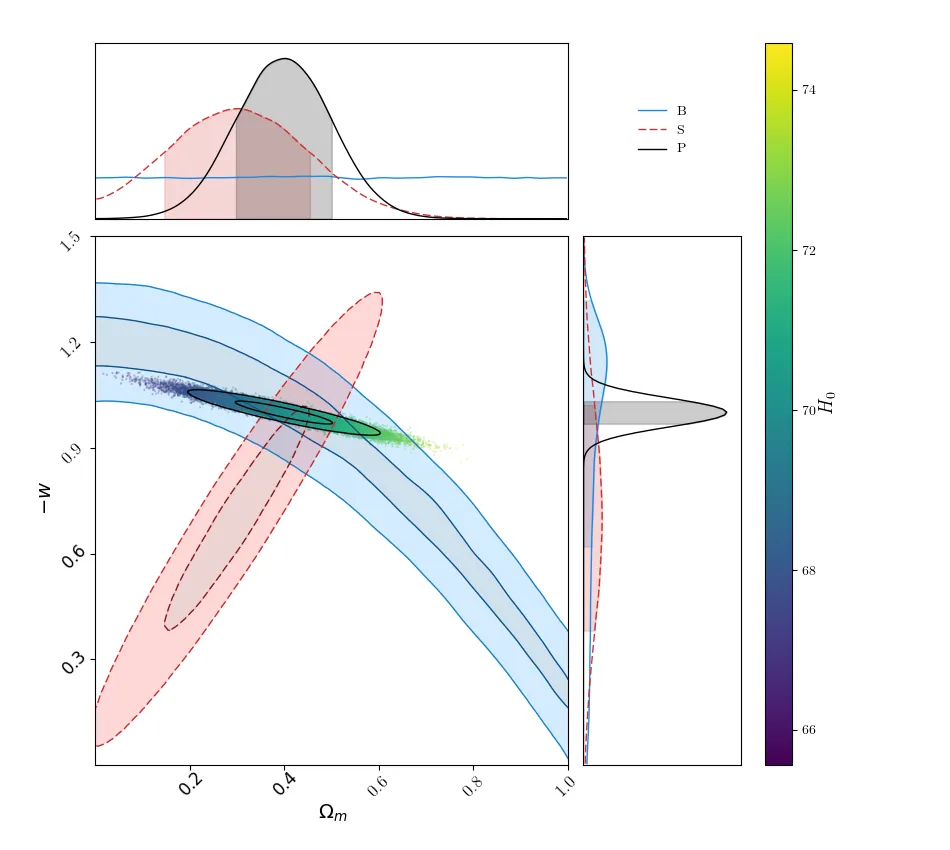
The largest use of the library is to create corner plots like this one, and so most of the customisation methods, such that you can get the plot below.
Upon request by various users, ChainConsumer now has extra functionality:
- Plot walks to provide a visual check for convergence
- Run converge diagnostics - the Gelman-Rubin statistic and Geweke diagnostic.
- Get parameter correlations and covariance - as a matrix or as a LaTeX table.
- Get parameter summaries, either as a python object or a LaTeX table.
- Compare models use the AIC, BIC and DIC tests.
Most of this is detailed in the glorious post I made but have yet had a chance to use!
{% include image.html ?class=“img-poster” url=“poster.jpg”)