RoyalRoad Data Infographic
2022-10-14
I was curious about how well stories did on RoyalRoad.
For those reading this, I assume you know what Royal Road is. For those may have misclicked: it’s a website where authors publish web serials, generally a chapter at a time, and generally at a freakishly fast pace (like one chapter a day). It’s home to many greats in the Progression Fantasy / LitRPG genre, and I have spent hundreds of hours as a consumer of these serials.
So I decided to try and extract some insights from Royal Road data about how page count, followers, ratings, etc, impact the serials success and patreon conversion.
TL;DR
Click here for the final conclusions
Scraping data
- Go through the latest updates, and grab a huge amount of story links using
requestsandbeautifulsoup4 - Open each of them, using file caching because this might take a while. Grab their statistics, and Patreon if they have one.
- Cry when this takes forever.
import asyncio
import json
from pathlib import Path
import re
from typing import Iterable


from bs4 import BeautifulSoup
import httpx
import matplotlib
import matplotlib.pyplot as plt
from mpl_toolkits.axes_grid1 import make_axes_locatable
import numpy as np
import pandas as pd
from scipy.interpolate import interp1d
import seaborn as sb

client = httpx.AsyncClient()

async def launch(all_args: list[str], func, batch: int = 20):
    """To speed things up, heres a concurrent batch async html fetcher"""
    i = 0
    resps = []
    while i < len(all_args):
        print(i, end=" ")
        args = all_args[i:i+batch]
        try:
            resps += await asyncio.gather(*map(func, args))
        except Exception as e:
            print(e)
            try:
                resps += await asyncio.gather(*map(func, args))
            except Exception as e:
                print(e)
        i += batch
return respsprint(f"Have {len(all_links)} stories to get.")Have 8879 stories to get.Now that we have all the links, next step: getting the stats.
BIG CAVEAT: To make sure I don’t just get the most popular releases, I’m going through the latest releases. However, that means I don’t expect to pick up finished works like Mother of Learning in these stats. Also, RR does not make the “Last Chapter Published Date” easy to find at all, so I’m not storing that information. I expect works on Hiatus to have a larger Patreon drop, but will be hard to see from this info.
Whew, what a nightmare. If only Royal Road had an official API. If it does… and I’ve missed it… don’t tell me. This too too long and I no longer want to know how much time I wasted.
Anyway, we can run this to get first all RoyalRoad stats, and then gather all the patreon links and gather that data too.
# This gets the RR stats
all_stats = await launch(all_links, get_stats_for_serial)Alright, the patreon stats is a bit easier, because we can filter for data-tags right away.
# Separate out patreon stats
stats_w_patreon = [s for s in all_stats if "patreon_link" in s]
urls_patreon = [s["patreon_link"] for s in stats_w_patreon]
urls_patreon = [s for s in urls_patreon if "www.patreon.com" in s]
patreon_stats = await launch(urls_patreon, get_patreon_stats, batch=5)Alright, so let’s grab the top 25 stories, ranked by number of followers.
df.head(25)[["Title", "Author", "Followers", "Rating", "Patron Count"]]| Title | Author | Followers | Rating | Patron Count | |
|---|---|---|---|---|---|
| 0 | Beware Of Chicken | Casualfarmer | 28543.0 | 4.779845 | 3971.0 |
| 1 | Azarinth Healer | Rhaegar | 23429.0 | 4.653555 | 3031.0 |
| 2 | He Who Fights With Monsters | Shirtaloon (Travis Deverell) | 19984.0 | 4.496575 | 6932.0 |
| 3 | The Primal Hunter | Zogarth | 19511.0 | 4.561625 | 3824.0 |
| 4 | Paranoid Mage | InadvisablyCompelled | 18470.0 | 4.740195 | 2390.0 |
| 5 | Delve | SenescentSoul | 18291.0 | 4.494240 | 1816.0 |
| 6 | Defiance of the Fall | TheFirstDefier | 15283.0 | 4.448760 | 3866.0 |
| 7 | Mark of the Fool | J.M. Clarke (U Juggernaut) | 14415.0 | 4.587905 | 993.0 |
| 8 | There is no Epic Loot here, Only Puns. | stewart92 | 14254.0 | 4.698535 | 949.0 |
| 9 | Salvos (A Monster Evolution LitRPG) | MelasDelta | 14088.0 | 4.570255 | 1186.0 |
| 10 | Beneath the Dragoneye Moons | Selkie | 13668.0 | 4.516565 | 3338.0 |
| 11 | Chrysalis | RinoZ | 13636.0 | 4.576400 | 1365.0 |
| 12 | The Path of Ascension | C_Mantis | 12491.0 | 4.528735 | 1903.0 |
| 13 | Vainqueur the Dragon | Maxime J. Durand (Void Herald) | 12394.0 | 4.716280 | 464.0 |
| 14 | Sylver Seeker | Kennit Kenway | 12326.0 | 4.543540 | NaN |
| 15 | Blue Core | InadvisablyCompelled | 12253.0 | 4.616485 | 2390.0 |
| 16 | The New World | Monsoon117 | 11964.0 | 4.460275 | 463.0 |
| 17 | The Runesmith | Kuropon | 11501.0 | 4.277465 | 567.0 |
| 18 | Forge of Destiny | Yrsillar | 11469.0 | 4.607040 | 418.0 |
| 19 | The Calamitous Bob | Mecanimus | 11209.0 | 4.733860 | 2027.0 |
| 20 | Jackal Among Snakes | Nemorosus | 11144.0 | 4.710550 | 805.0 |
| 21 | Metaworld Chronicles | Wutosama | 11050.0 | 4.541275 | NaN |
| 22 | Tree of Aeons (An isekai story) | spaizzzer | 10926.0 | 4.517970 | 819.0 |
| 23 | A Journey of Black and Red | Mecanimus | 10643.0 | 4.750410 | 2027.0 |
| 24 | The Essence of Cultivation | Agranulocytosis | 10546.0 | 4.727825 | NaN |
If you want the csv data, I’ve uploaded it to here.
Plotting
Alright, so we have our dataframe, which means we can now get to plotting.
Let’s just have a quick look at the distribution of Followers, because I imagine most stories are pretty much dead on arrival.

Let’s zoom in on this distribution…
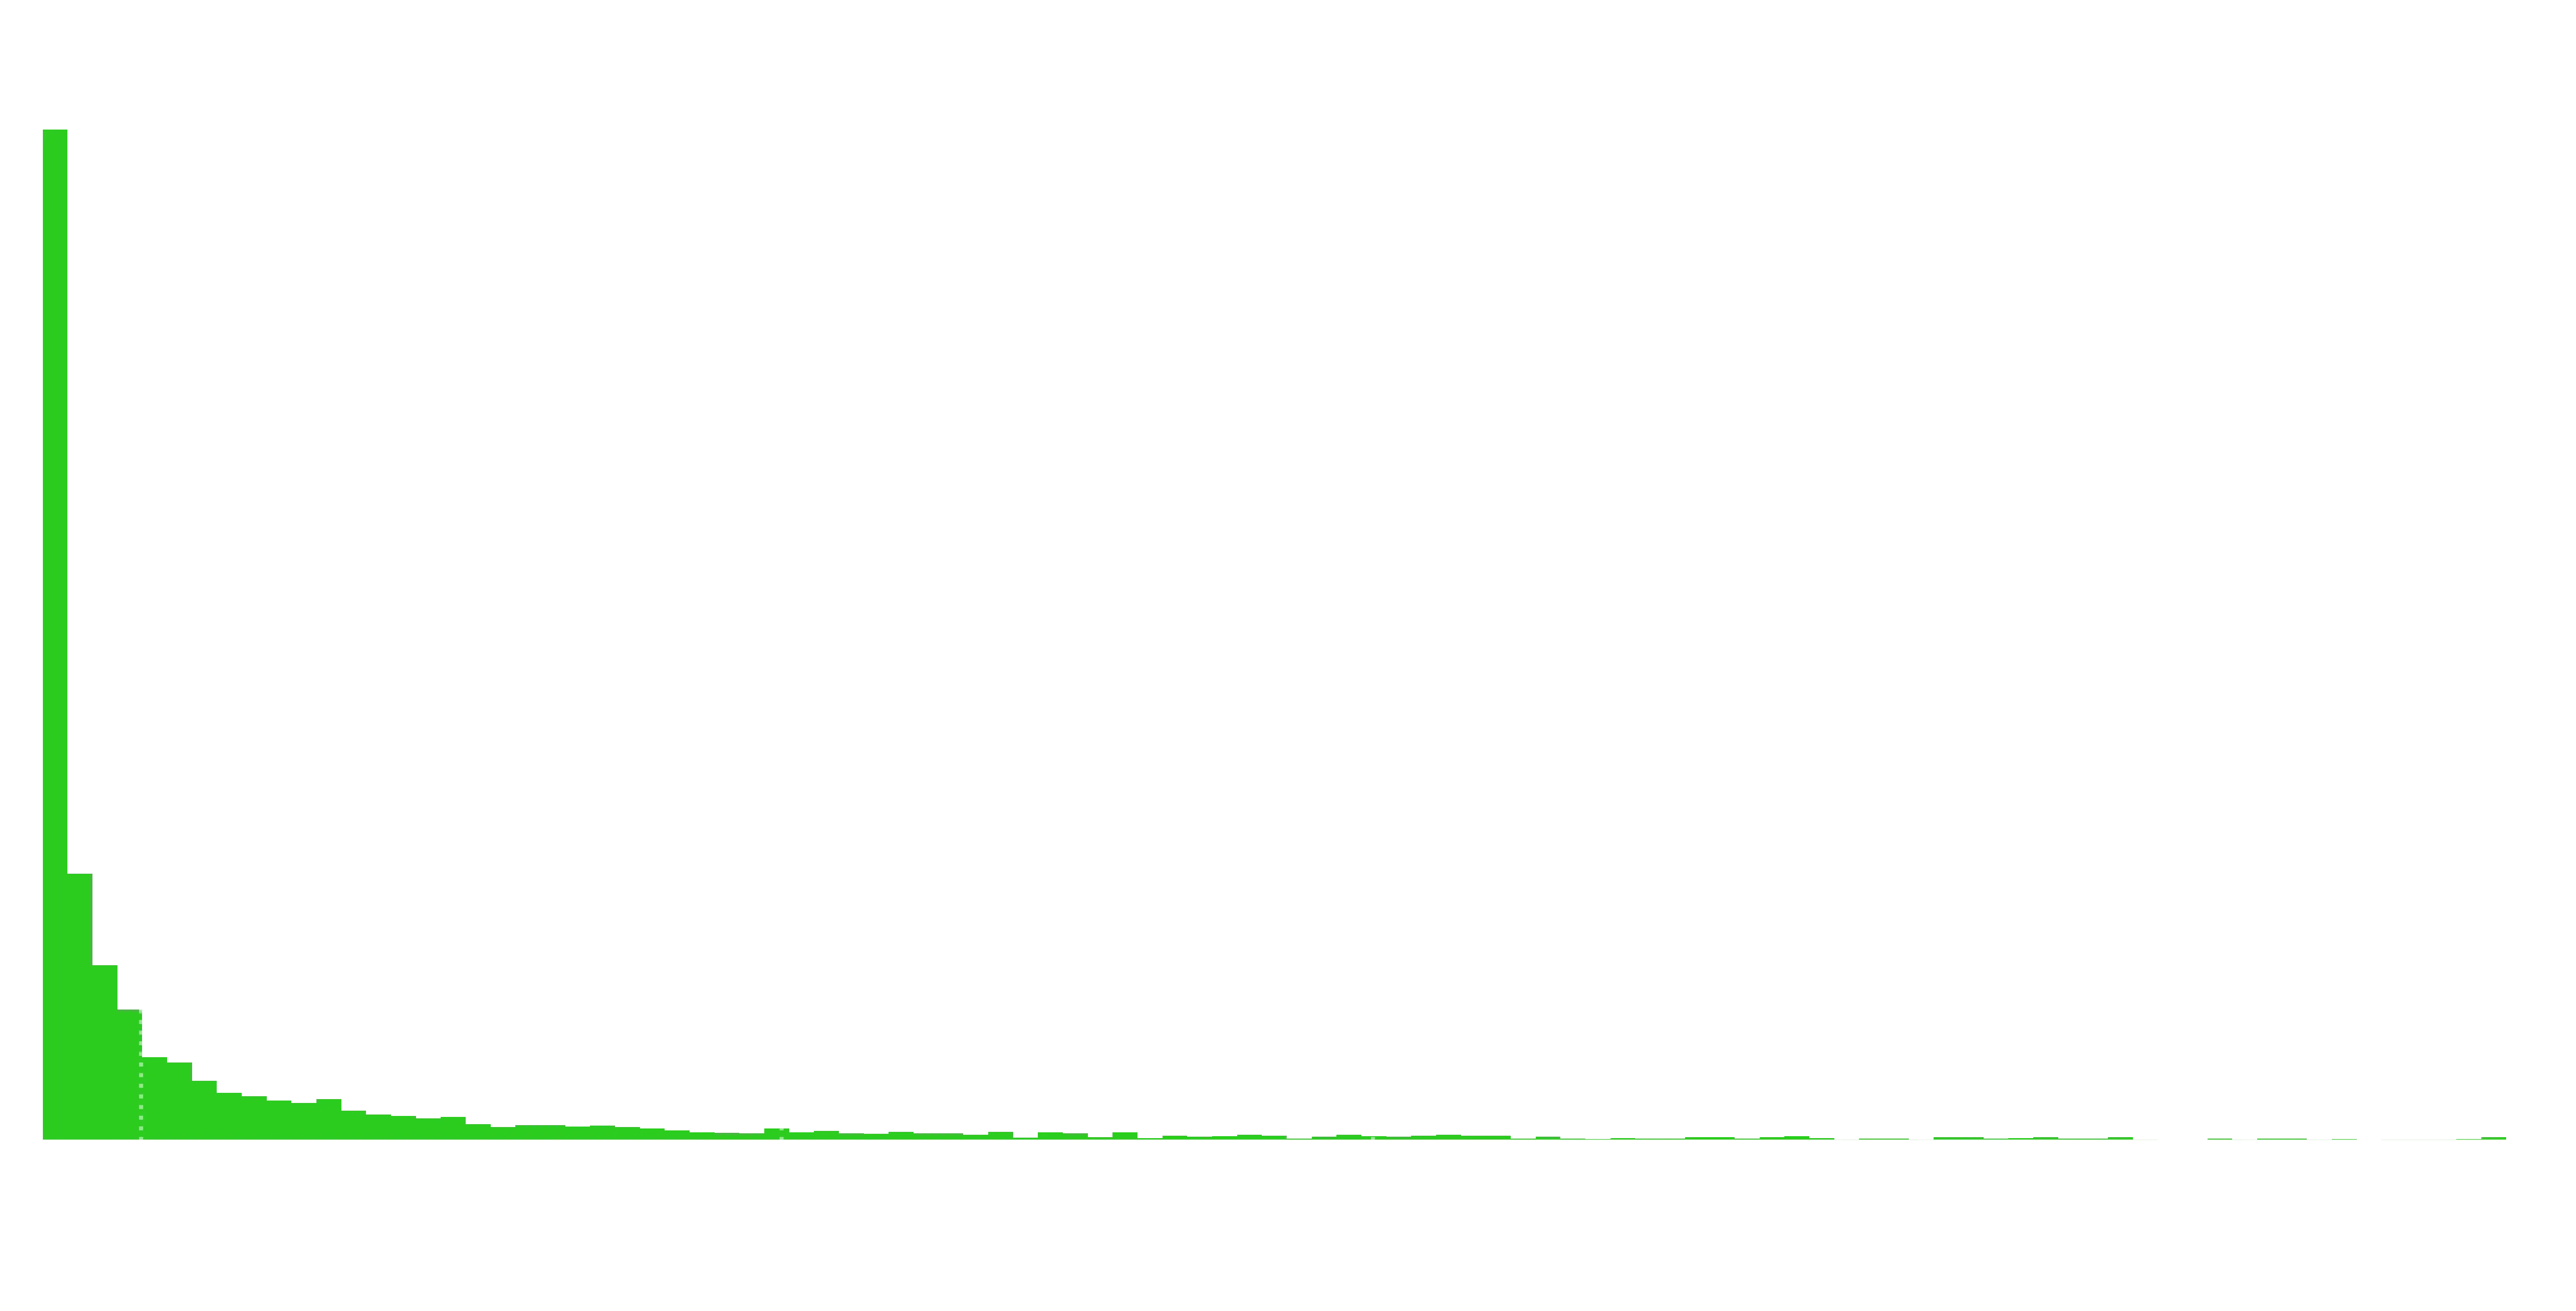
Ouch. So the majority of serials have essentially no followers. The median number of followers is 4. If you break 330, you’re in the top 10%. You’ll need around 5000 for the top 1%.
def get_established(df: pd.DataFrame, threshold=100) -> pd.DataFrame:
df = df[df["Followers"] > threshold].copy()
df["Patron Value"] = df["Earnings"] / df["Patron Count"]
df["Patron Rate"] = df["Patron Count"] / df["Followers"]
df["Favourite Rate"] = df["Favorites"] / df["Followers"]
df["Follow Rate (Total)"] = df["Followers"] / df["Total Views"]
df["Follow Rate (Avg)"] = df["Followers"] / df["Average Views"]
df["Rating Rate"] = df["Ratings"] / df["Followers"]
return df
df_established = get_established(df)I’m going to filter out a lot of stories with 100 followers when making some distributions, just because we need enough followers to get some good statistics like a converged average rating.

Obviously we expect most of these correlations. The more views you have, the more followers, means the more favourites, and the more ratings. And the more patrons, the higher your earnings, of course. Interestingly, page count does very little, along with Rating. So those aren’t significant barriers to entry, rejoice those who have been review bombed!
# Look into avergae profit per patreon
plot_hist(df_established, "Rating", qfmt="%0.2f", bins=40)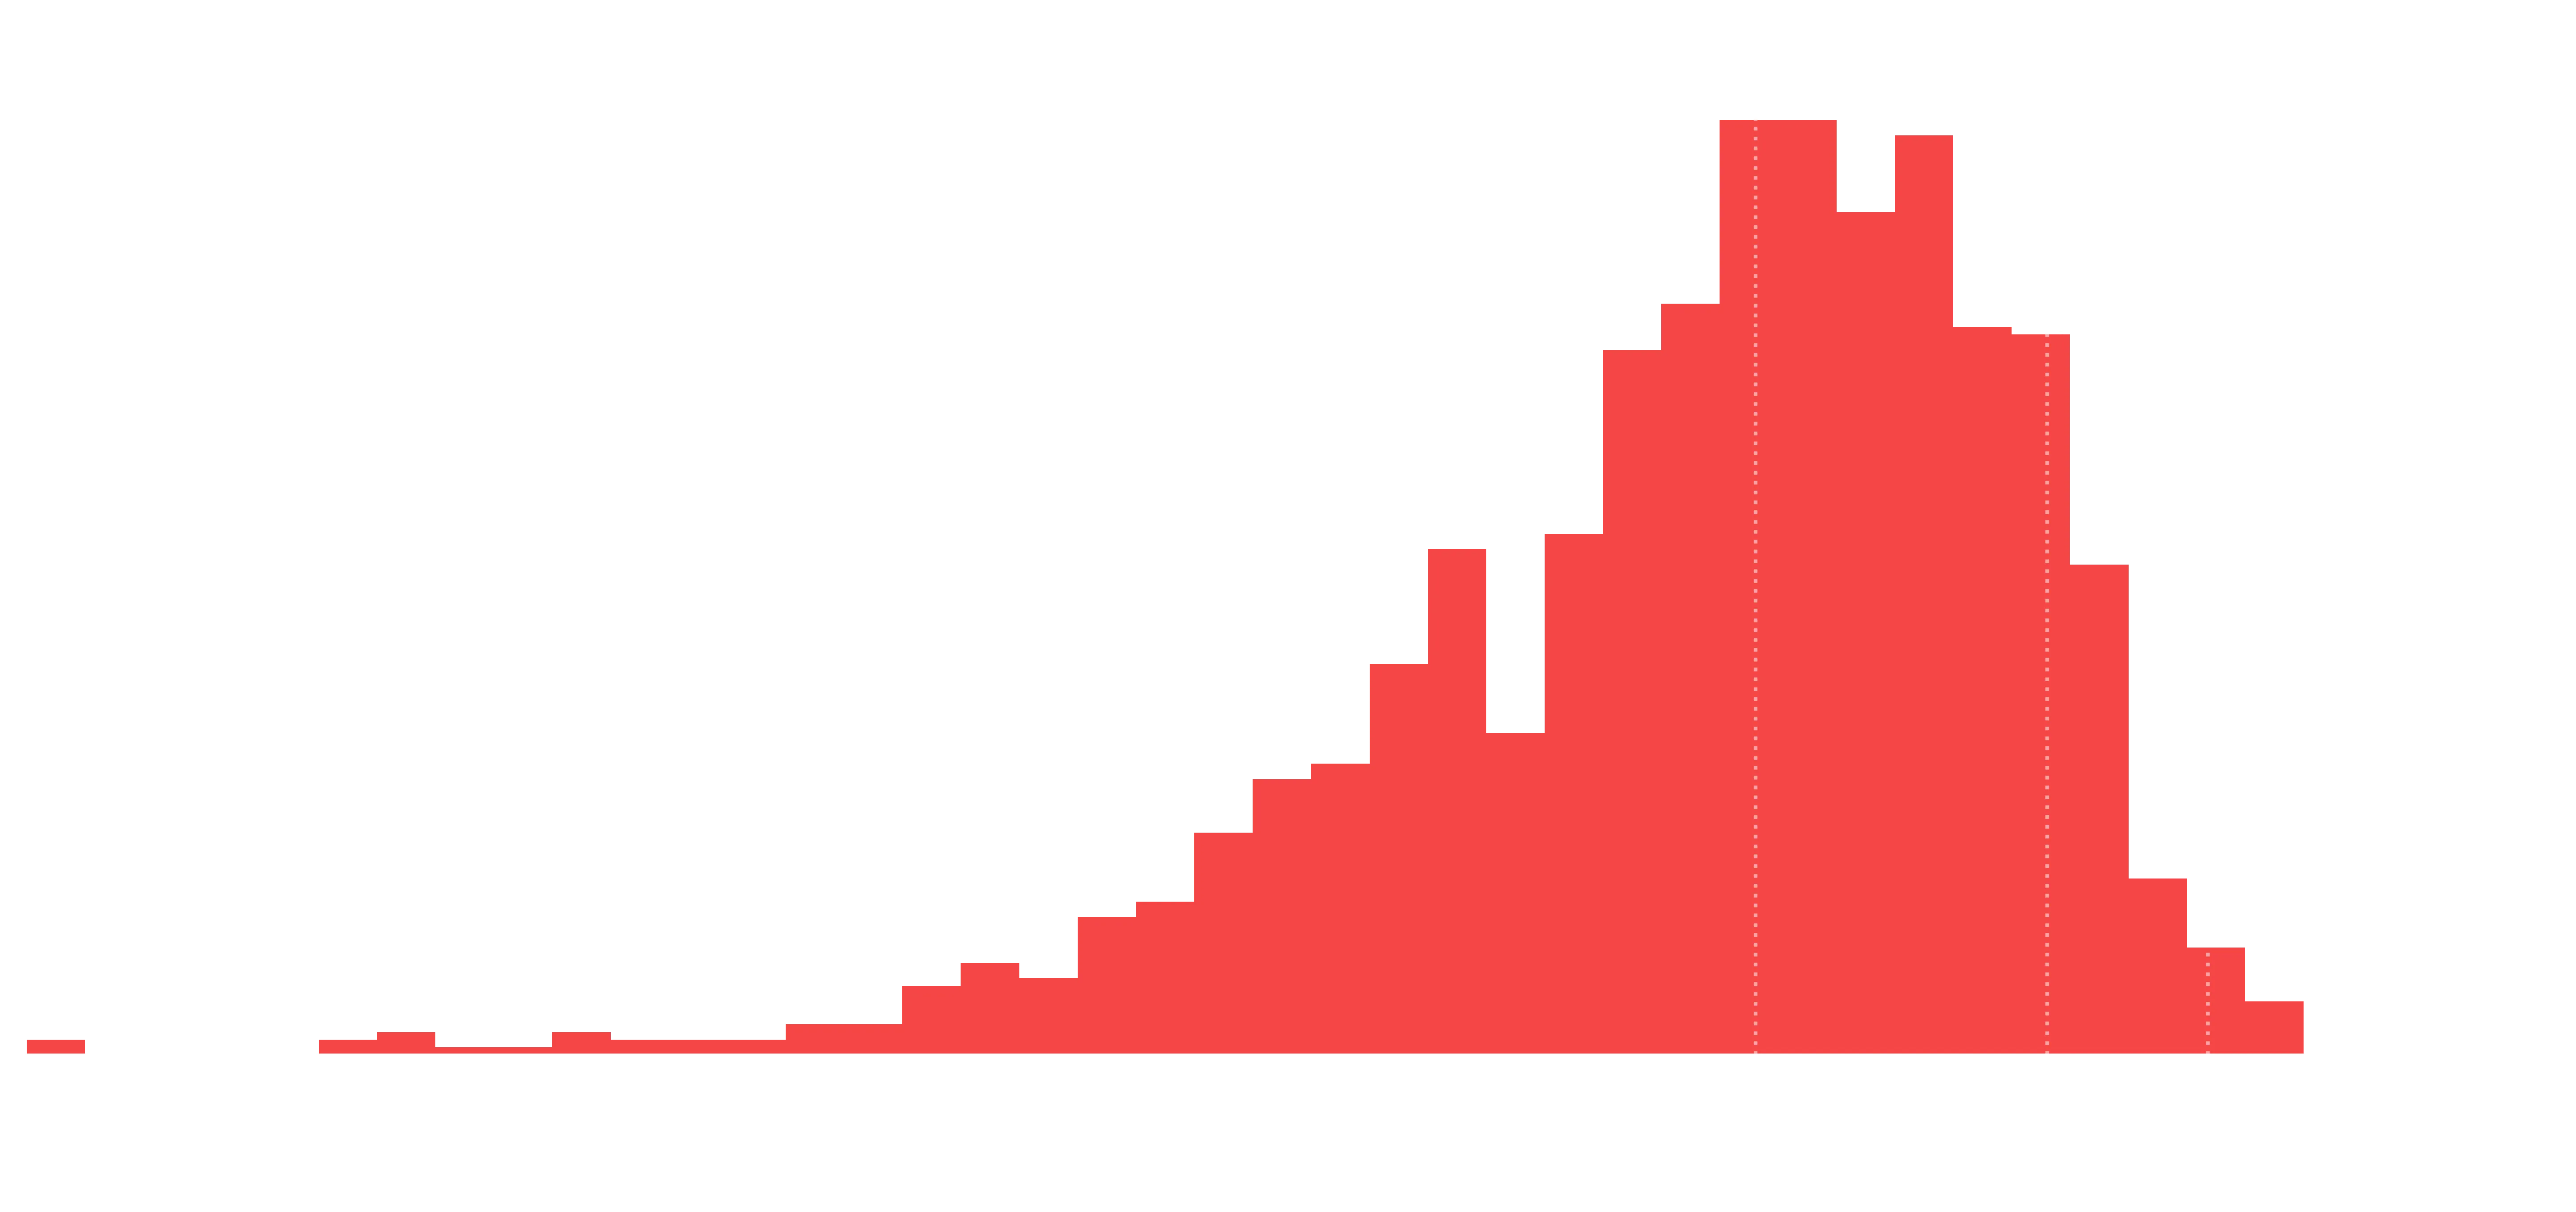
The standard 4.5 stars distribution seen everywhere with a 5 star rating system.
plot_hist(df_established, "Favourite Rate", qfmt="%0.2f")
So for every 100 followers, the median story gains 24 favourites.
plot_hist(df_established, "Rating Rate", qfmt="%0.2f")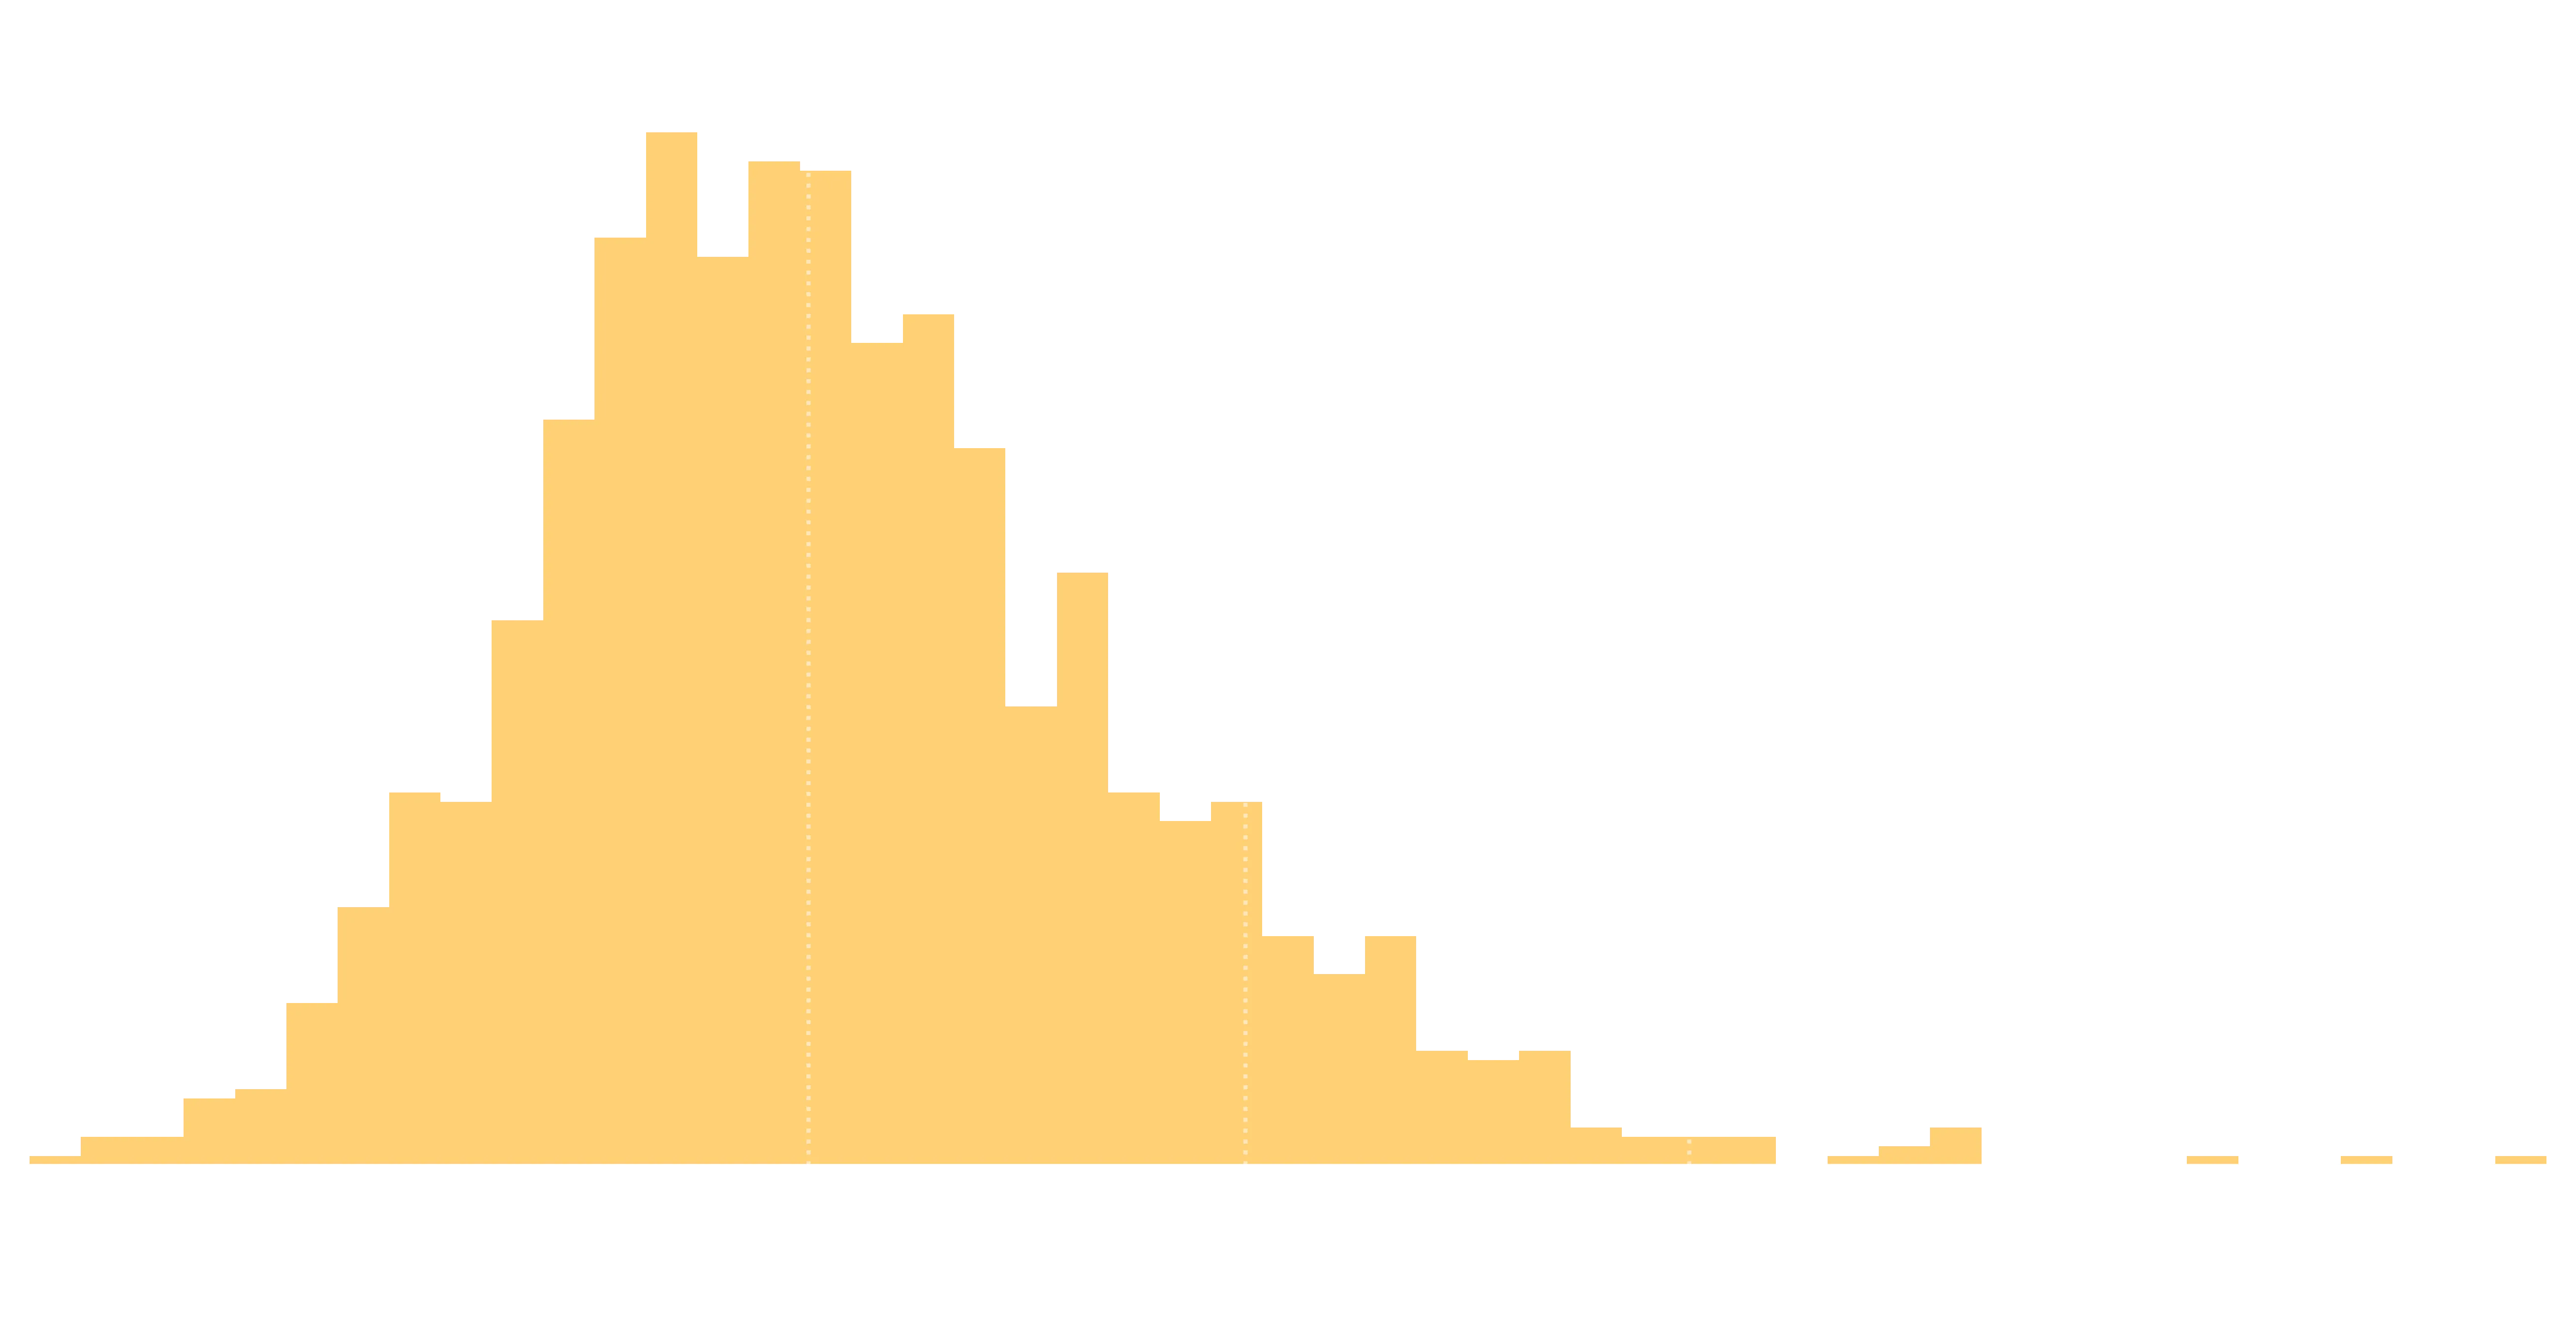
Looks like a similar story for the ratings. Median conversion of 23% from follow to a rating.
plot_hist(df_established, "Follow Rate (Avg)", qfmt="%0.2f", bins=80)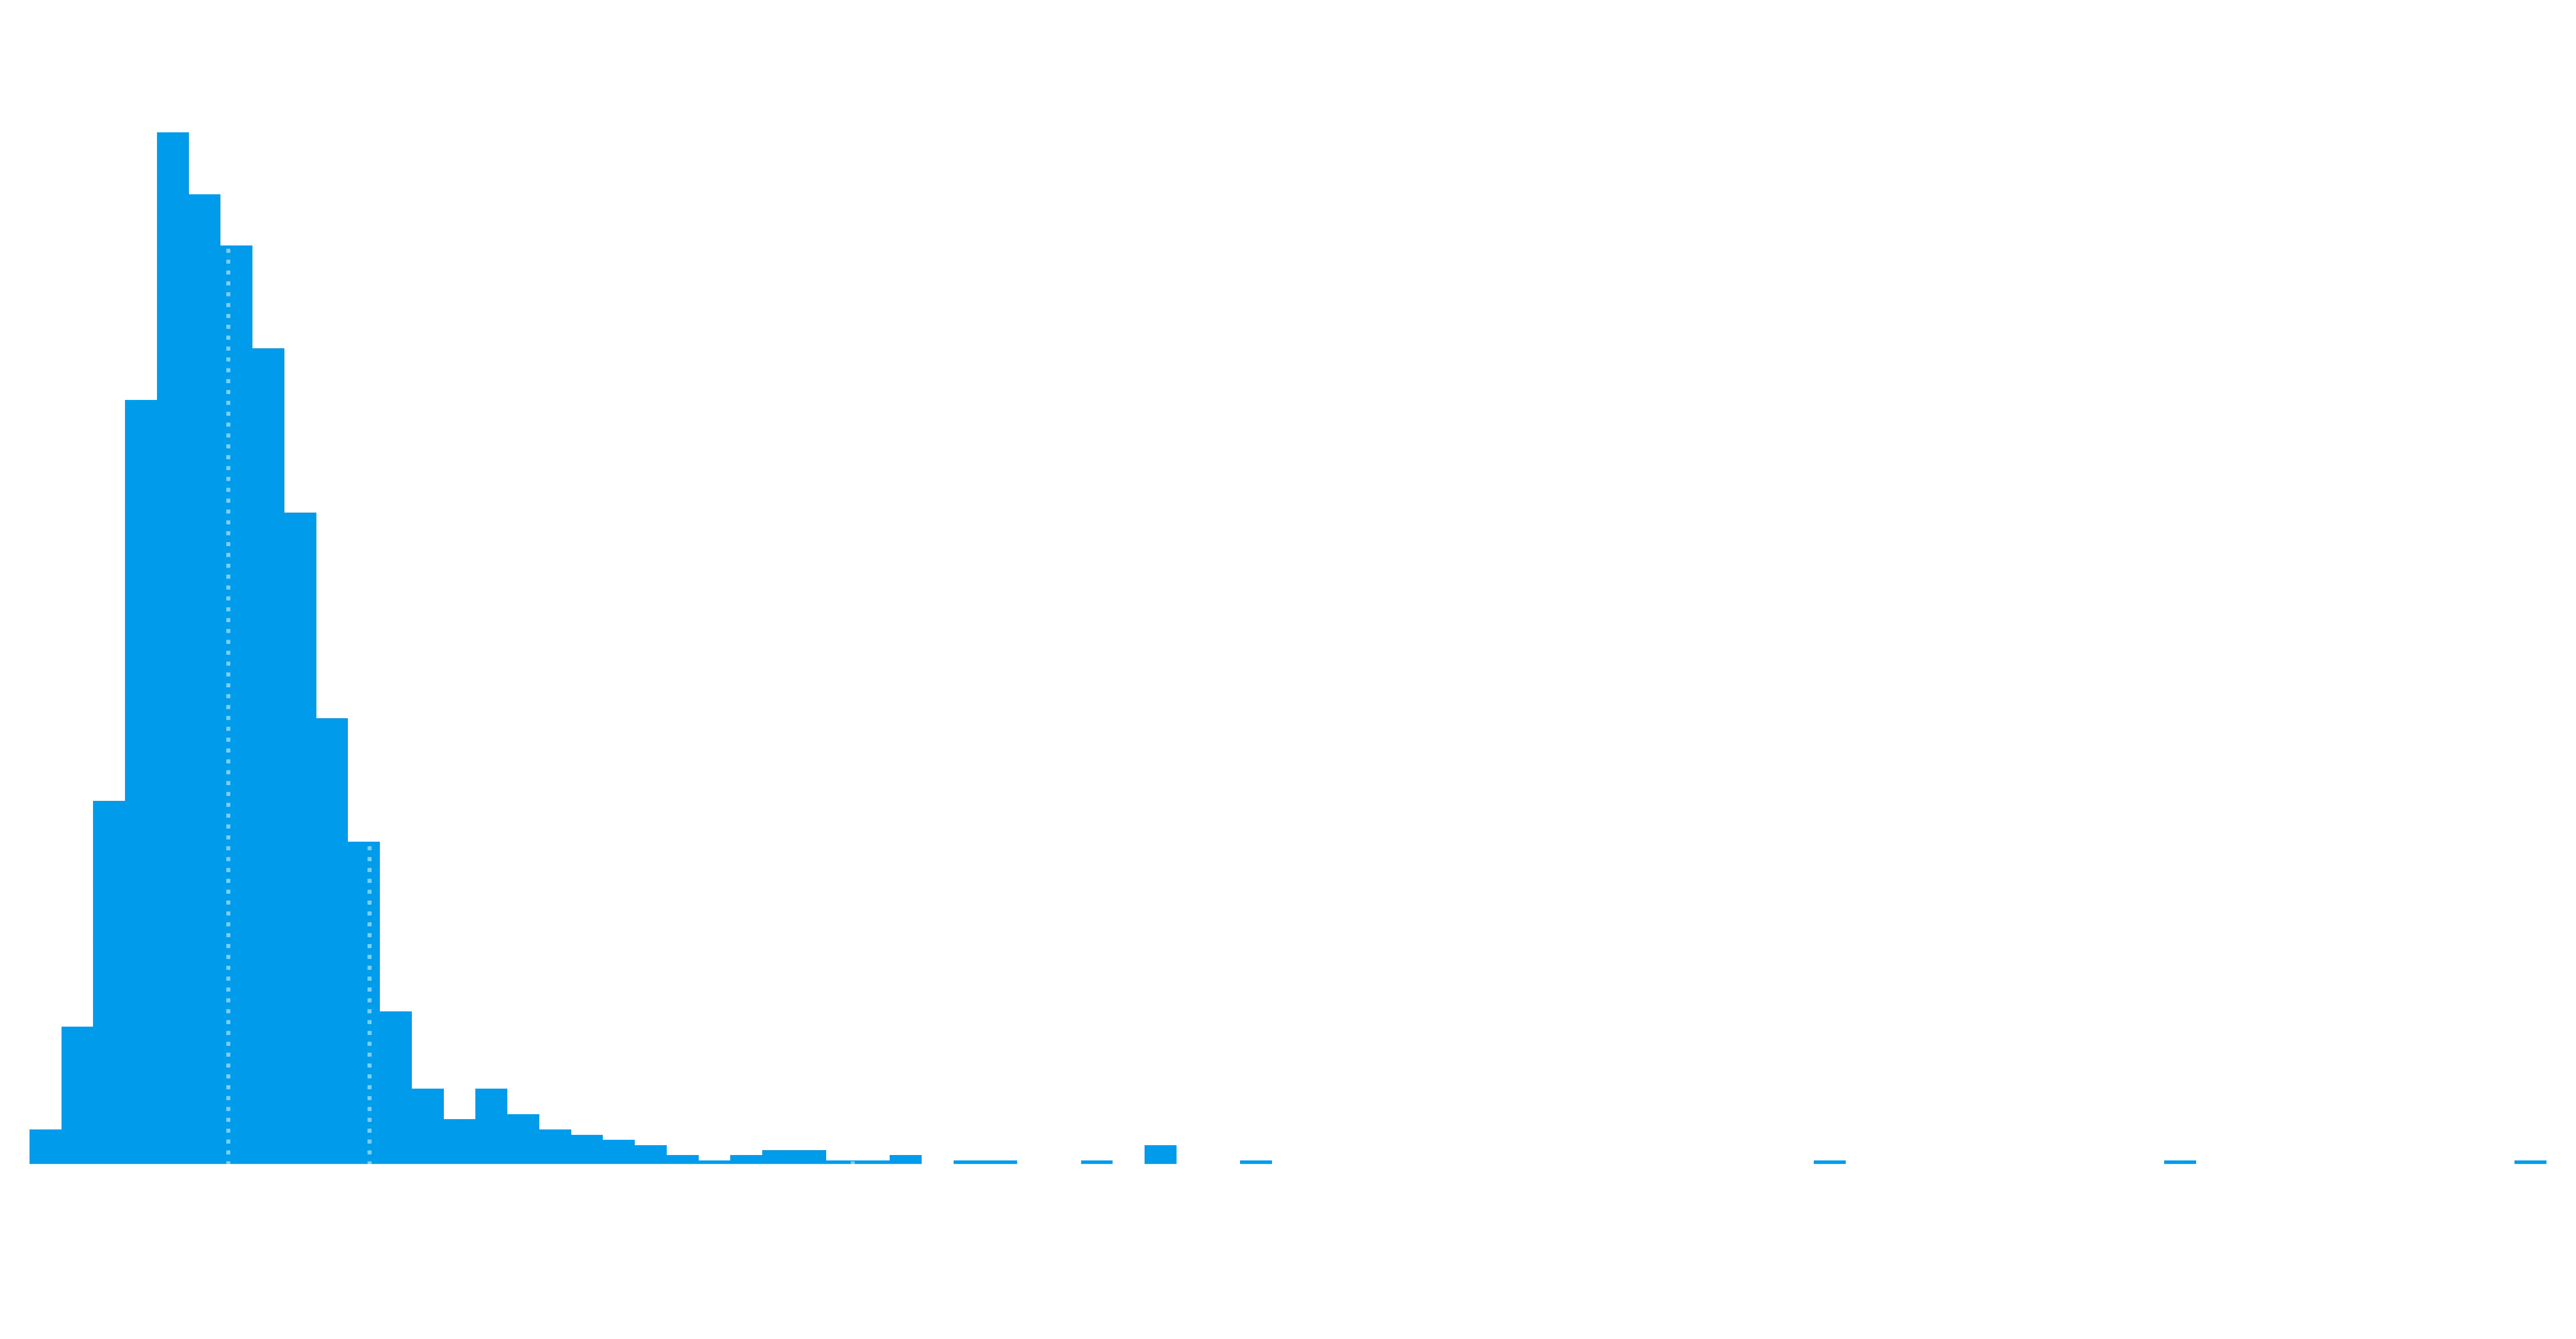
This is a bit harder to interpet, because I don’t believe RR is giving us a total number of unique visitors (indeed its hard to determine that number without browser fingerprinting anyway). So instead we have the average views per chapter, and I’m curious how this translates into the number of followers. Note, I don’t have the average number of followers per chapter, which would be a much better bit of data. So the plot above, in my mind, is almost useless. But what it does (maybe) show is that if an author gets 10k views per chapter, the median would have that translate into a story with 2.9k followers.
I also expect the above to be highly dependent on hiatus and gaps in the story, but again, don’t have the data. Frustrated there’s no official API.

The higher conversion rate numbers might be unreliable. This assumes that the RR stories I’ve found are the only funnels into Patreon, and this might not be correct, especially for stories which are also released in other locations.

As a caveat, not all patreons have their income public, so this is only using that subset where we have both income and number of patrons.
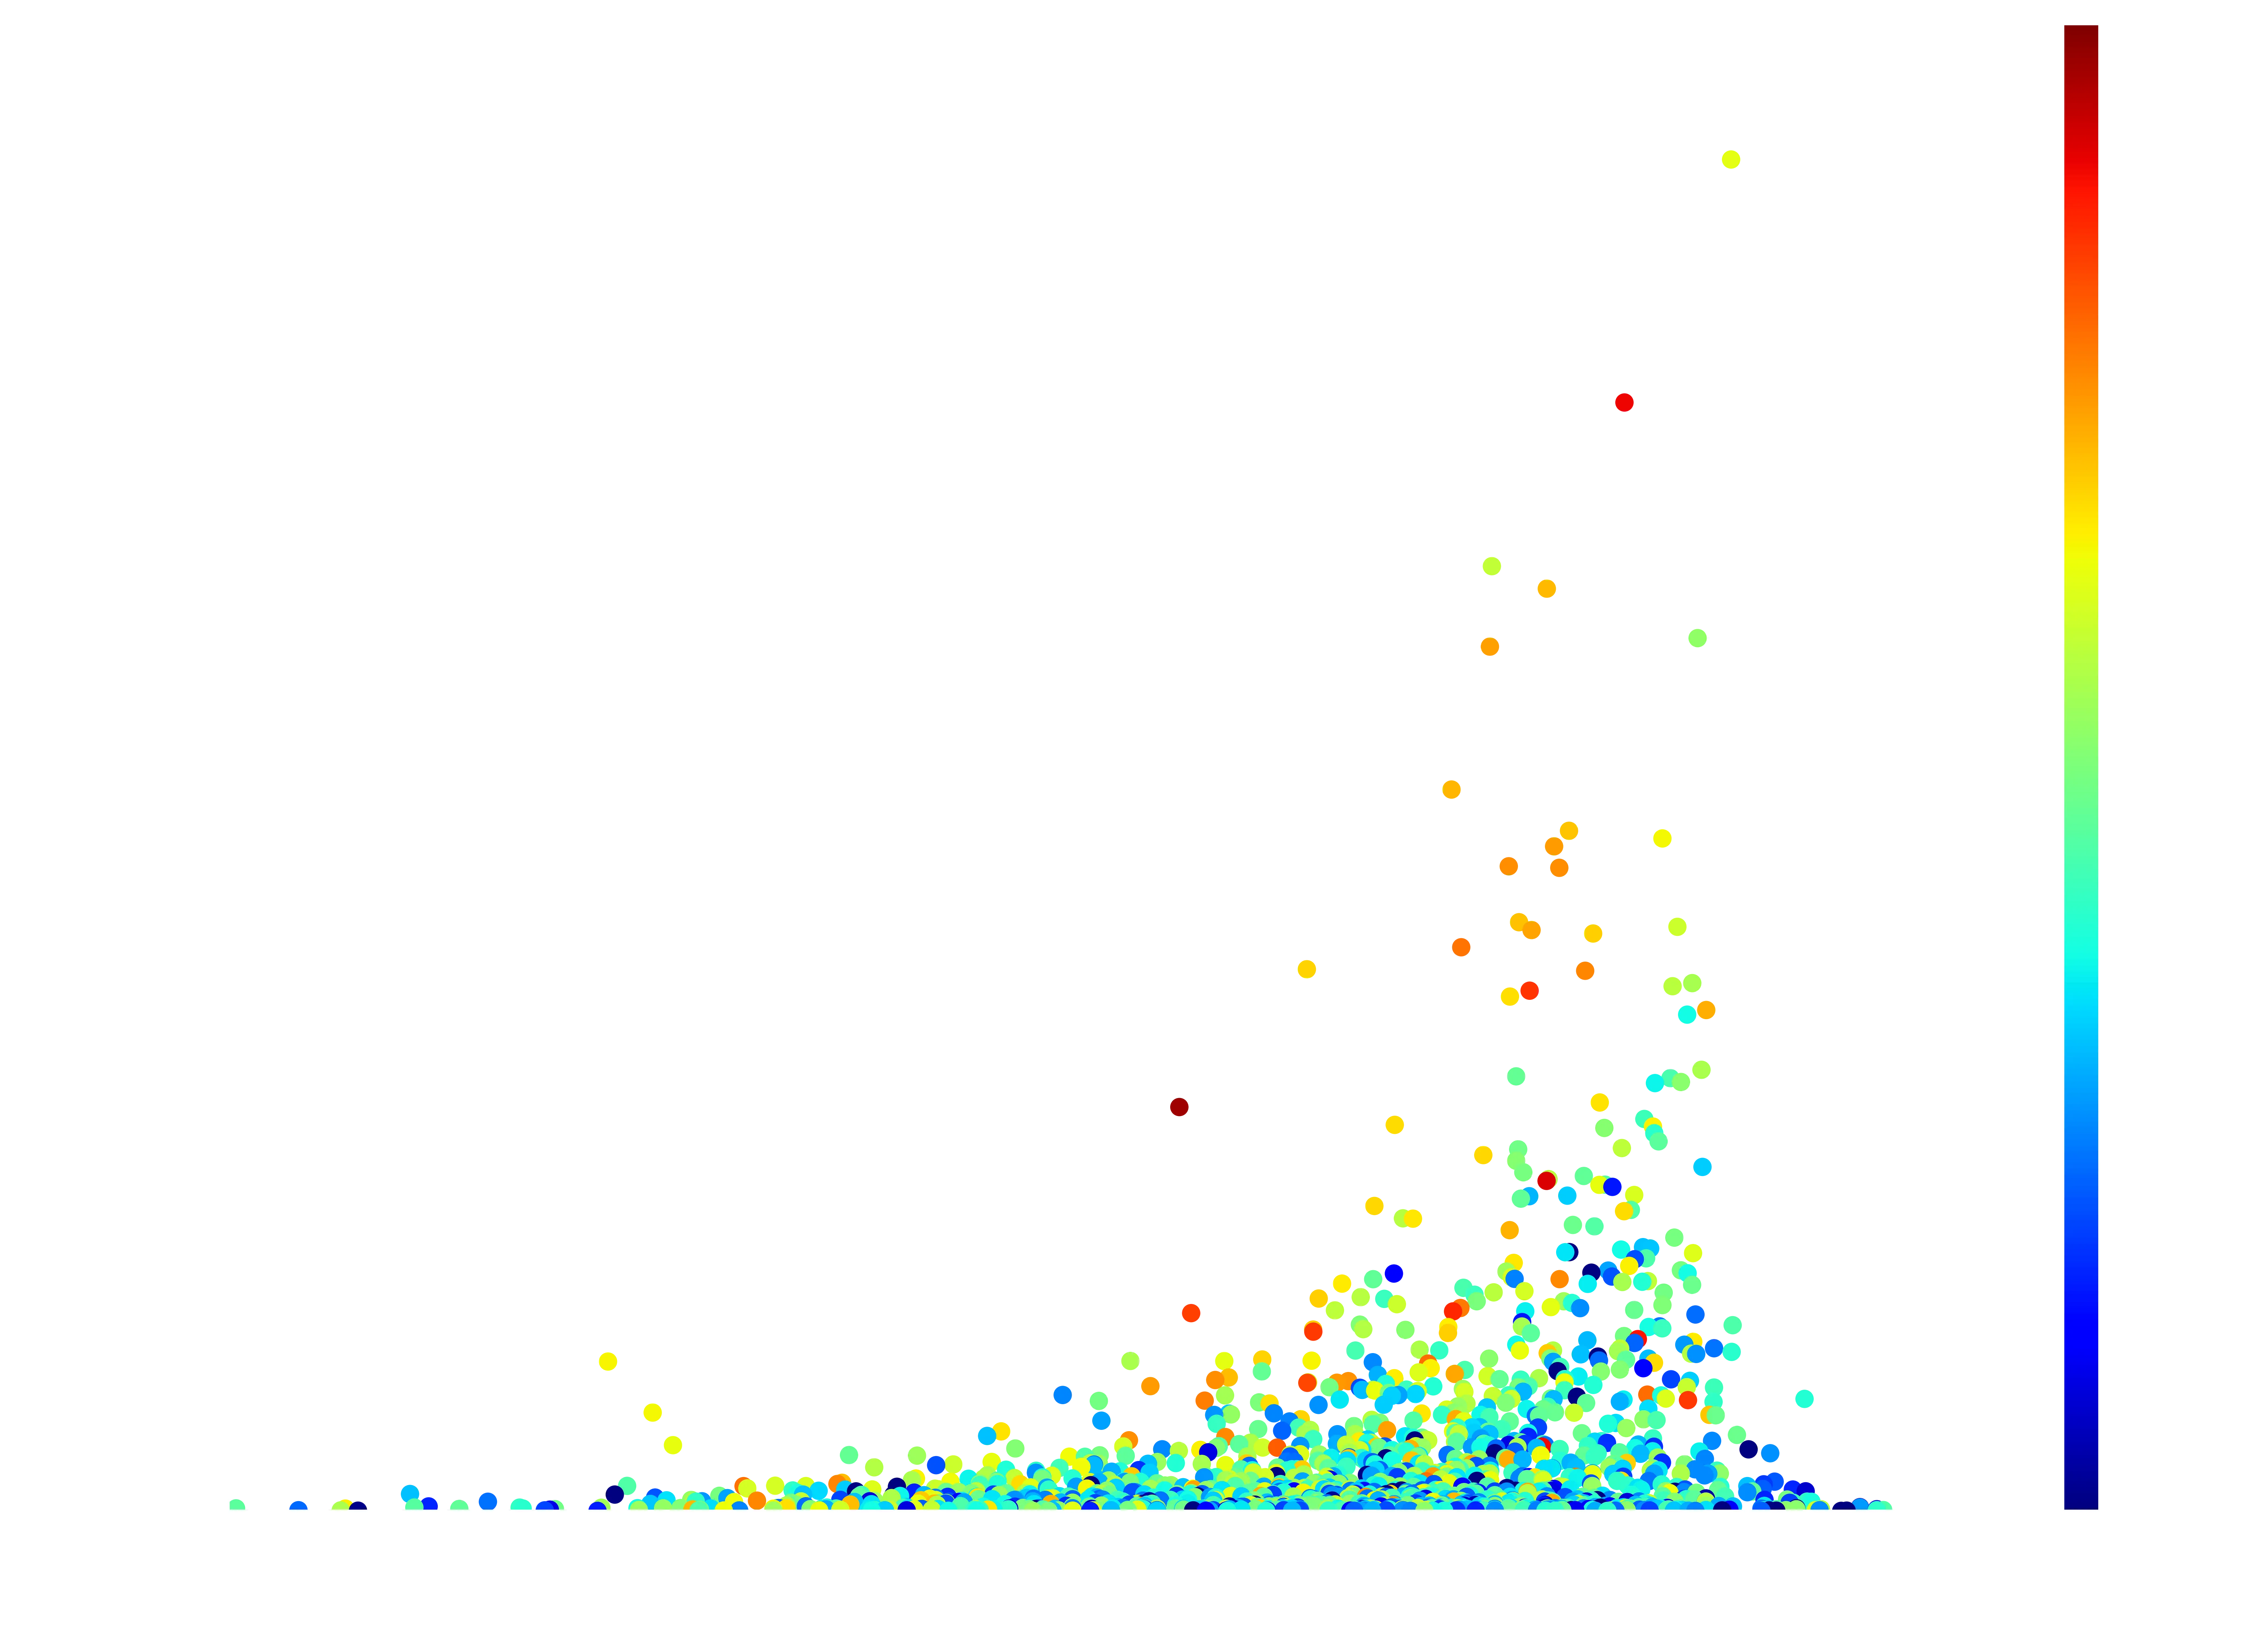
Savage Divinity with that monstrous word count. If only The Wandering Inn was on RR, it would destroy everything. But apart from that, notice how asymmetric this distribution is, and how the higher follower stories shift higher in the ratings as well.
Summary
Interesting things we note:
- Page count nor rating is useful in predicing followers, or income.
- In general, the more Followers you get, your average rating will be higher. This is probably just the fact you can average out rating bombs if you have enough people.
- Typically about 30% of Followers will leave a rating.
- Its hard to get Patreon conversion, 2% is the median, and even the top 10% aren’t breaking 20%.
- However, each conversion represents about 5USD, which is nice.
- Beware of Chicken is absolutely crushing the Follower count.
- The grind for new stories is horrific. 50% of stories updated in the last 6 months have four followers or less. The top ten percent are only in aruond 300, which isn’t enough for a proper readership and career swap. The top 1% get around 5000 followers.
- If you’re above 4.4 stars, you’re above average.
For your convenience, here’s the code in one block:
import asyncio
import json
from pathlib import Path
import re
from typing import Iterable
from bs4 import BeautifulSoup
import httpx
import matplotlib
import matplotlib.pyplot as plt
from mpl_toolkits.axes_grid1 import make_axes_locatable
import numpy as np
import pandas as pd
from scipy.interpolate import interp1d
import seaborn as sb
client = httpx.AsyncClient()
async def launch(all_args: list[str], func, batch: int = 20):
"""To speed things up, heres a concurrent batch async html fetcher"""
i = 0
resps = []
while i < len(all_args):
print(i, end=" ")
args = all_args[i:i+batch]
try:
resps += await asyncio.gather(*map(func, args))
except Exception as e:
print(e)
try:
resps += await asyncio.gather(*map(func, args))
except Exception as e:
print(e)
i += batch
return resps
# This was run as of 2022-10-15
async def get_last_updates(page=1) -> list[str]:
    url = f"https://www.royalroad.com/fictions/latest-updates?page={page}"
    # Fetch the HTML
    response = await client.get(url)
    # Parse it into a useful object
    soup = BeautifulSoup(response.content, "html.parser")
    # And now extract links to each serial
    return [a.attrs["href"] for a in soup.select(".fiction-title a")]

pages = list(range(1, 501))
all_links = await launch(pages, get_last_updates, batch=5)
# Fetch things again, because if anyone updated while we were fetching, they would change pages
all_links += await launch(pages, get_last_updates, batch=5)
all_links = [l for links in all_links for l in links]

with open("royal_road/list.json", "w") as f:
    json.dump(all_links, f)
all_links = list(set(all_links))
print(f"Have {len(all_links)} stories to get.")
# To help with iteration later, ignore this
def pairwise(iterable: Iterable) -> Iterable:
    a = iter(iterable)
    return zip(a, a)

def get_plink(plink):
    # Alas some of the patreon links people have put cause redirects... so got to fix those
    plink = plink.replace("&", "?").replace("https://patreon", "https://www.patreon").replace("user=", "u=")
    if "patreon.com" not in plink:
        return None
    if "?" in plink:
        base = plink.split("?", maxsplit=1)[0]
        if "u=" in plink:
            user = plink.split("u=", maxsplit=1)[1].split("?")[0]
            base += f"?u={user}"
        return base
    return plink

async def get_stats_for_serial(link: str) -> dict:
    url = f"https://www.royalroad.com{link}"
    response = await client.get(url)
    soup = BeautifulSoup(response.content, "html.parser")
    stats_block = soup.select(".fiction-stats .stats-content", limit=1)[0]

    stats = {
        "link": url,
        "title": soup.select('meta [name="twitter:title"]')[0].attrs["content"],
        "author": soup.select('meta [name="twitter:creator"]')[0].attrs["content"]
    }

    # Extract the metadata hints behind the stars
    for meta in stats_block.select("meta"):
        attrs = meta.attrs
        stats[attrs["property"]] = attrs["content"]

    # Extract the human readable statistics (super flaky)
    styled = stats_block.select(".list-unstyled li")
    for title, stat in pairwise(styled):
        if not stat.text.strip():
            continue
        value = float(stat.text.replace(",","").strip())
        key = title.text.replace(":", "").strip()
        stats[key] = value

    # And grab patreon if we can
    patreon_links = [a.attrs["href"] for a in soup.find_all("a", href=True) if "patreon" in a.attrs["href"]]
    if patreon_links:
        plink = get_plink(patreon_links[0])
        if plink is not None:
            stats["patreon_link"] = plink
    return stats
# This gets the RR stats
all_stats = await launch(all_links, get_stats_for_serial)
async def get_patreon_stats(link: str) -> dict[str, float]:
    response = await client.get(link)
    soup = BeautifulSoup(response.content, "html.parser")

    # Extra everything using the data-tag and h2 below it
    page_stats = [x for x in soup.select('[data-tag*="Stats"]')]
    stats = {"patreon_link": link}
    expr = re.compile(r"[\d\.]")
    for d in page_stats:
        key = "".join(d.attrs["data-tag"].split("-", maxsplit=1)[1:])
        value = d.find("h2")
        if value is None:
            continue
        value = float("".join(expr.findall(value.text)))
        if key.lower() == "earnings":
            # Ill save out USD as of todays conversion, AUD is probably not as useful
            value *= 0.681642
        stats[key] =value
    return stats
# Separate out patreon stats
stats_w_patreon = [s for s in all_stats if "patreon_link" in s]
urls_patreon = [s["patreon_link"] for s in stats_w_patreon]
urls_patreon = [s for s in urls_patreon if "www.patreon.com" in s]
patreon_stats = await launch(urls_patreon, get_patreon_stats, batch=5)
# Turn this into a dataframe, and save it out.
save_dir = Path("royal_road")
save_dir.mkdir(parents=True, exist_ok=True)

df_stats = pd.DataFrame(all_stats).drop(columns=["bestRating", "ratingCount"])
df_patreon = pd.DataFrame(patreon_stats)
df = df_stats.merge(df_patreon, on="patreon_link", how="left")
df = df.rename(columns={
    "ratingValue": "Rating"
})
df.columns = [x.replace('_', " ").replace("-", " ").title() for x in df.columns]
df = df.sort_values(["Followers",  "Patron Count"], ascending=False)
df = df.drop_duplicates(subset=["Title", "Author"], keep="first").reset_index(drop=True)
# Actually for some reason some of these explicit floats are being turned into strings?
for c in df:
    try:
        df[c] = pd.to_numeric(df[c])
    except:
        pass
df.to_csv(save_dir / "stats.csv", index=False)
df.head(25)[["Title", "Author", "Followers", "Rating", "Patron Count"]]
def plot_hist(df, col, quantiles=[0.5, 0.9, 0.99], bins=50, xlim=None, qfmt="%0.0f", **kw):
    _, ax = plt.subplots()
    if xlim is None:
        xlim = (df[col].min(), df[col].max())
    y, x, _ = ax.hist(df[col], bins=np.linspace(*xlim, bins), **kw)
    xc = 0.5 * (x[1:] + x[:-1])
    if quantiles:
        interp = interp1d(xc, y, bounds_error=False, fill_value=(y[0], y[-1]))
        for q, q_val in zip(quantiles, df[col].quantile(quantiles)):
            qstr = qfmt % q_val
            qy = interp(q_val) + 0.03 * y.max()
            ax.axvline(q_val, alpha=0.5, ls=":", lw=1)
            ax.annotate(f"{1-q:0.0%} > {qstr} {col}", (q_val, qy))
    ax.set_xlim(*xlim)
    ax.set_xlabel(col)

plot_hist(df, "Followers", bins=500, xlim=(0, 6000))
plot_hist(df, "Followers", bins=100, quantiles=[0.5, 0.75, 0.8], xlim=(0, 100))
def get_established(df: pd.DataFrame, threshold=100) -> pd.DataFrame:
    df = df[df["Followers"] > threshold].copy()
    df["Patron Value"] = df["Earnings"] / df["Patron Count"]
    df["Patron Rate"] = df["Patron Count"] / df["Followers"]
    df["Favourite Rate"] = df["Favorites"] / df["Followers"]
    df["Follow Rate (Total)"] = df["Followers"] / df["Total Views"]
    df["Follow Rate (Avg)"] = df["Followers"] / df["Average Views"]
    df["Rating Rate"] = df["Ratings"] / df["Followers"]
    return df
df_established = get_established(df)
# Use correlation to show pages and rating are the weakest indicators of Followers
def plot_cor(df):
    cor = df.corr(numeric_only=True)
    ax = sb.heatmap(cor, square=True)
    ax.set_title("Correlations")

plot_cor(df_established)
# Look into avergae profit per patreon
plot_hist(df_established, "Rating", qfmt="%0.2f", bins=40)
plot_hist(df_established, "Favourite Rate", qfmt="%0.2f")
plot_hist(df_established, "Rating Rate", qfmt="%0.2f")
plot_hist(df_established, "Follow Rate (Avg)", qfmt="%0.2f", bins=80)
# Covnersion between Followers/Favourites to Patreon count'
def plot_prate(df):
    # Have to group authors with multiple stories leading to same patreon
    df2 = df.groupby("Patreon Link").sum(numeric_only=True).reset_index()
    df2 = df2[df2["Patron Rate"] < 1.0].copy()
    plot_hist(df2, "Patron Rate", qfmt="%0.3f", bins=100, xlim=(0, 0.5), quantiles=[0.5, 0.7, 0.9])

plot_prate(df_established)
# Curious about the average value of each patron
plot_hist(df_established, "Patron Value", qfmt="$%0.2f", bins=55, quantiles=[0.5, 0.75, 0.9, 0.99])
#Create overview plot
def plot_overview(df, ax, fig):
    x = df["Rating"]
    y = df["Followers"]
    c = df["Pages"]
    s = 20
    h = ax.scatter(x, y, c=c, s=s, cmap="jet", norm=matplotlib.colors.LogNorm(vmin=50, vmax=c.max() * 1.2),)
    divider = make_axes_locatable(ax)
    cax = divider.append_axes('right', size='2%', pad=0.05)
    fig.colorbar(h, cax=cax, orientation='vertical', label="Pages")
    ax.set_xlim(3, x.max() * 1.04)
    ax.set_ylim(y.min(), 1.1 * y.max())
    ax.set_xlabel("Rating")
    ax.set_ylabel("Followers")

    padding = y.max() * 0.01
    replace = {
        "He Who Fights With Monsters": "HWFWM",
        "Salvos (A Monster Evolution LitRPG)": "Salvos",
        "Defiance of the Fall": "DotF",
        "There is no Epic Loot here, Only Puns.": "Only Puns"
    }
    offset = {
        "HWFWM": (-0.15, -1.5),
        "The Primal Hunter": (0.2, 3),
        "Paranoid Mage": (0.22, -1.5),
        "Delve": (-0.12, -1.5),
        "Mark of the Fool": (0.15, 1),
        "Salvos": (-0.15, 0),
        "Only Puns": (0.15, -1.3),
    }
    def annotate(i, row):
        t = replace.get(row['Title'], row['Title'])
        o = offset.get(t, (0,1))
        pos = x[i], y[i]
        arrow = dict(arrowstyle="-", alpha=0.3, lw=0.5, shrinkA=0, shrinkB=3) if t in offset else None
        ax.annotate(t, pos, (x[i] + o[0], (padding * o[1]) + y[i]), va="bottom", ha="center", arrowprops=arrow)

    for i, row in df.head(10).iterrows():
        annotate(i, row)
    for i, row in df.sort_values("Pages", ascending=False).head(1).iterrows():
        annotate(i, row)

fig, ax = plt.subplots(figsize=(10, 8))
plot_overview(df_established, ax, fig)